
Desktop Tools for Monitoring Blockchain Nodes & Cluster Health
The Value of Dedicated Telemetry
Monitoring high-velocity decentralized protocols requires robust analytical tools. When transactions process in milliseconds across thousands of validator nodes, standard web-based block explorers cannot provide the real-time granular insight required for debugging smart contract state transitions or measuring packet latency.
In this guide, we review the top desktop monitoring tools, CLI utilities, and open-source telemetry setups used by professional protocol analysts.
1. CLI Diagnostic Suites & Native Watchers
Every node operator and systems engineer begins with command-line diagnostic tools.
Key CLI Commands:
cluster-nodes: Inspects the active gossip network, displaying IP addresses, pubkeys, software versions, and stake weights of all peered validators.ping: Measures round-trip latency and slot confirmation speeds directly against the cluster leader.validators: Displays current epoch voting performance, delinquent status, and skip rates across the network.logs: Subscribes to real-time program execution logs via local WebSocket feeds, essential for debugging failing CPI transactions.
# Example: Monitoring live program logs via CLI
protocol-cli logs --filter "ProgramID11111111111111111111111111111111" --commitment processed
2. Desktop Telemetry Dashboards: Prometheus & Grafana
For continuous 24/7 observability, bare-metal server nodes export raw metrics into Prometheus time-series databases, rendered via custom Grafana dashboards:
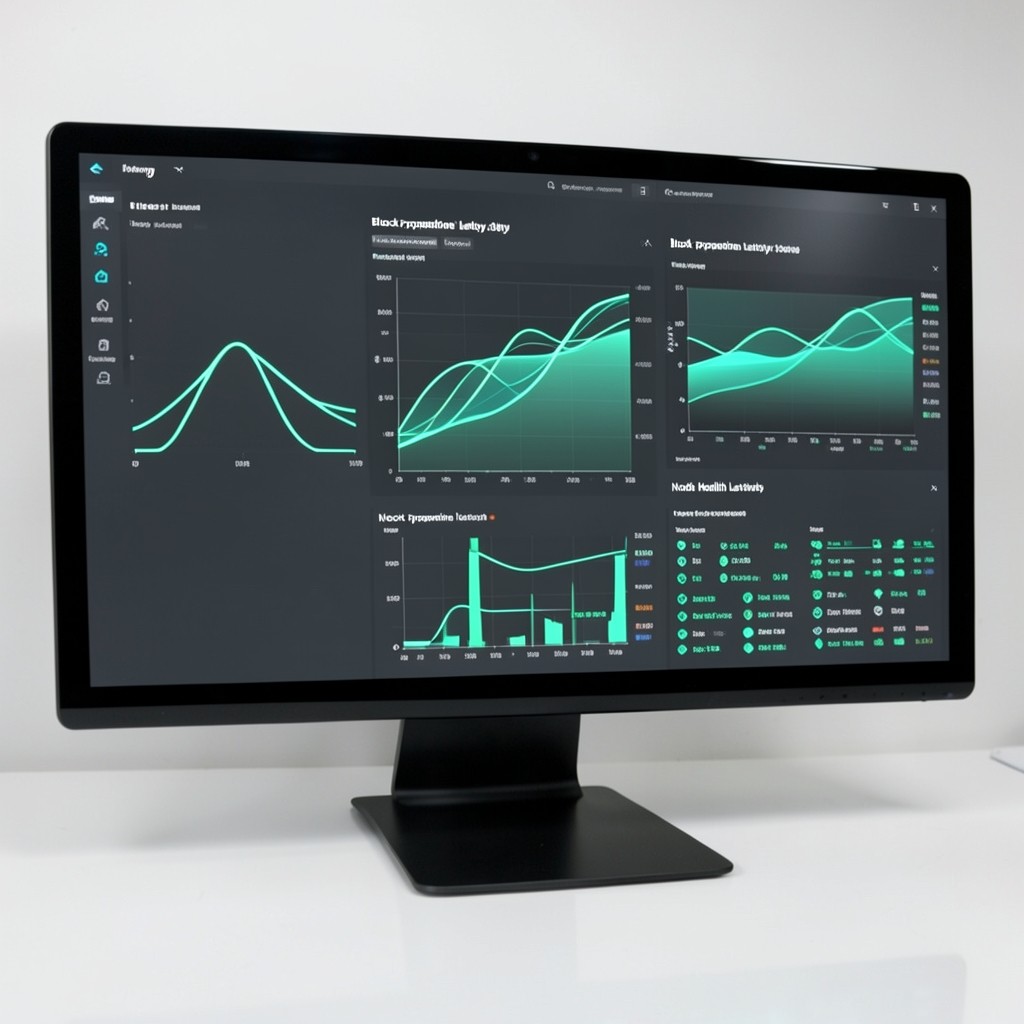
Essential Grafana Telemetry Panels:
- Slot Time & TPS Gauge: Tracks live transactions per second (TPS) split between voting transactions and user compute instructions.
- Leader Slot Execution Duration: Monitors whether block assembly completes comfortably within the 400ms slot allocation or risks getting skipped due to NVMe I/O delays.
- Memory & TPU Buffer Saturation: Watches network interface packet drop rates and RAM buffer utilization during periods of sudden network traffic spikes.
- Vote Latency Distribution: A histogram showing the time delta between block production and vote credit recording.
3. Transaction Inspection & Local Simulators
When testing complex dApp smart contracts or multi-step swaps, desktop simulation harnesses provide instant feedback without spending network fees:
- Local Validator Testnets: Run a full single-node cluster locally with sub-second reset cycles to test edge cases.
- Transaction Payload Decoders: Desktop utilities that decode base64 transaction byte arrays into readable JSON schemas showing instruction accounts, signatures, and signers.
Recommended Desktop Workstation Setup
For dedicated protocol research and validator monitoring:
- Operating System: Ubuntu LTS 24.04 or macOS with high-resolution multi-monitor output.
- Telemetry Display: One monitor dedicated to real-time Grafana telemetry and gossip latency maps; secondary display dedicated to code editors and CLI logs.
- RPC Access: A low-latency private or dedicated RPC endpoint with WebSocket subscription capabilities.
To learn how to configure your own desktop monitoring suite from scratch, join our Ecosystem Tooling Workshop.